Fig. 6. Serum ghrelin levels present in L. rohita Fingerlings of different treatment groups. Each bar represents the mean ± SE (n = 6). Letters denote significant differences between the control group and treatment groups (p<0.05).
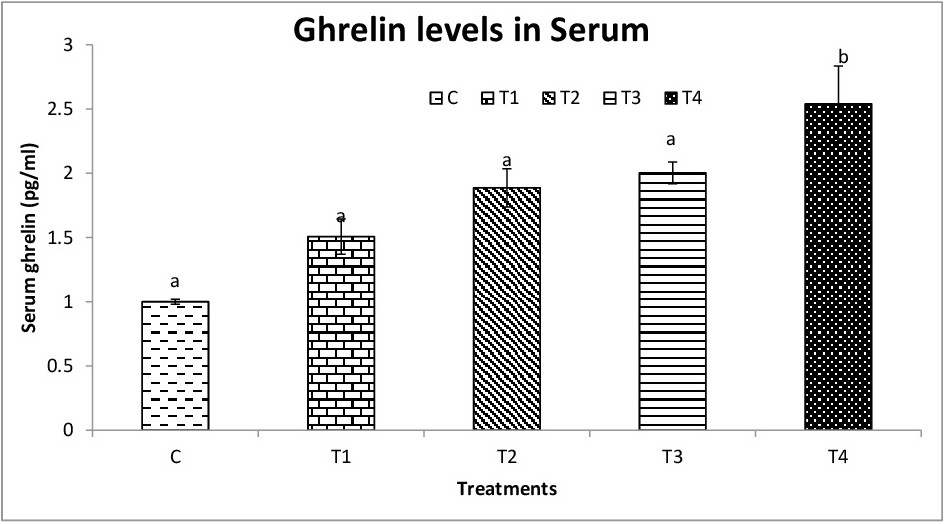
Fig. 6. Serum ghrelin levels present in L. rohita Fingerlings of different treatment groups. Each bar represents the mean ± SE (n = 6). Letters denote significant differences between the control group and treatment groups (p<0.05).